Grafana Stack with InfluxDB
Collecting and analyzing metrics are the key to understand a system’s runtime behaviors and thus to provide a better guideline of optimization. As the user of a metrics system, you might want to collect metric and event with simple APIs, retrieve historical metric data, and view visualized metrics statistics.
This article shows you how to build a metric system with StatsD, influxdb, and Grafana, as an example metrics system that composes of a client, a data storage, and visualization UI. There are many available open source packages.
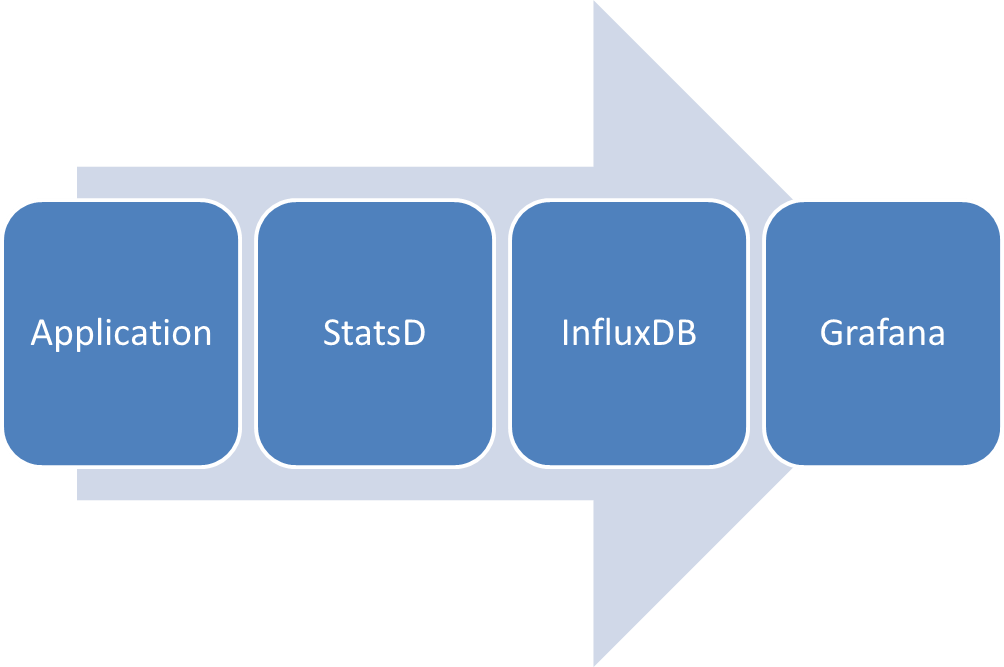
The figure above shows you the data flow. User configures the application, and sends metrics to StatsD server. StatsD stores the metrics data in InfluxDB, a time-series database, where Grafana retrieves data and displays the visualized metrics.
Let’s briefly discuss the software collection before moving on to configuration.
- StatsD is a daemon that collects and aggregates metrics data. With the well-accepted UDP protocol, clients library for almost all major programming language. In the meantime, StatsD can also serves as a local aggregator, providing a extensible backend architecture.
- Grafana is a metrics dashboard that provides data visualization and generates statistic graph. You can choose the most suitable approach to install. Configuration file can be found here.
- InfluxDB is a time-series database for storing the metrics data.
StatsD
When the StatsD is placed in a suitable location, please edit config.js to configure StatsD to send data to InfluxDB. Possible example is as below:
1 | 1.{ |
Please note that the key word backends, which specifies the destination of the metrics data, and the dependency could be installed as below:
1 | 1.$ cd statd |
flushInterval is set to send batch of information to InfluxDB every 10s by default. keyNameSanitize, please set it to false when you are connecting InfluxDB or have some special characters in the name tags.
Grafana
Configuration for Grafana mainly contains two sections, one is for Data Sources, and another is for templating/query. I will focus on configure the data source in the article.
Since the DataSource can only be configured after organisation is created, it would be better to sign-up as root and create a default organisation. Then change the anonymous auth settings with your newly-created org. This will allow users without login view the stats information, but they won’t be able to modify the charts’.
If you created the root user (you may call it whatever you like), and login with the detail, you will find the DataSource section looks like this snapshot:
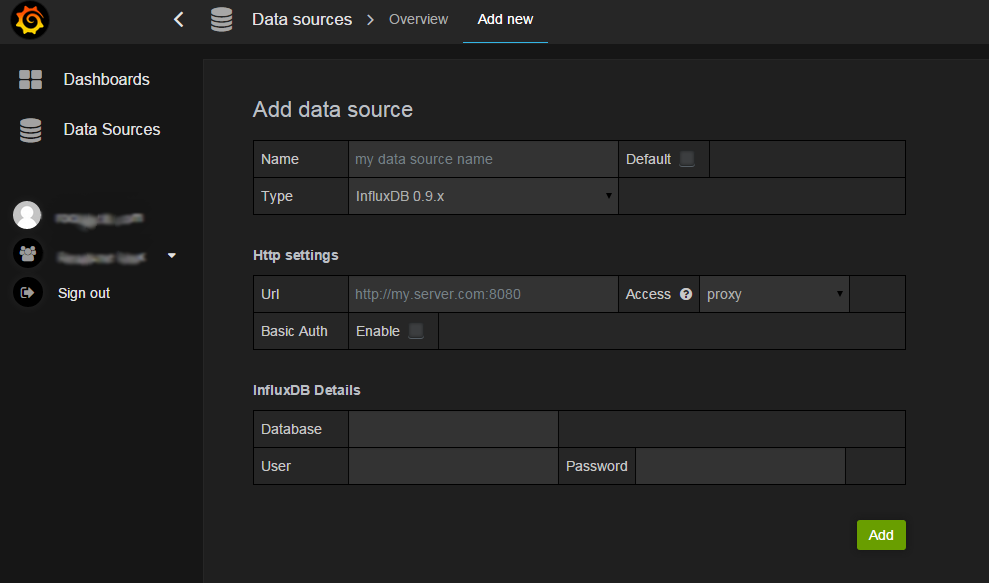
Select InfluxDB 0.9 as the latest (or whatever your influxDB version is), and then enter details you set for your InfluxDB instance. In the dashboard you may create a new graph point to your new data source.
InfluxDB
Once database service is started, the default port for Admin Web UI is 8083, and DataSource Port is 8086.
In the admin UI, the dropdown menu shows some template query for basic operation. As mentioned before influxDB offers a SQL-like query style. Simply put, MEASUREMENTS is equivalent to TABLE, TAGS is equivalent to COLUMNS, and POINTS is equivalent to ROW. The above link shows a comprehensive induction on how to query InfluxDB.
This link shows how to connect to InfluxDB with command-line, if you prefer a geeky way. To find a full document on how InfluxDB works in detail, please click here (Google Search always points to older version).
Once influxDB is installed, it would fairly easy to use. No much settings required.
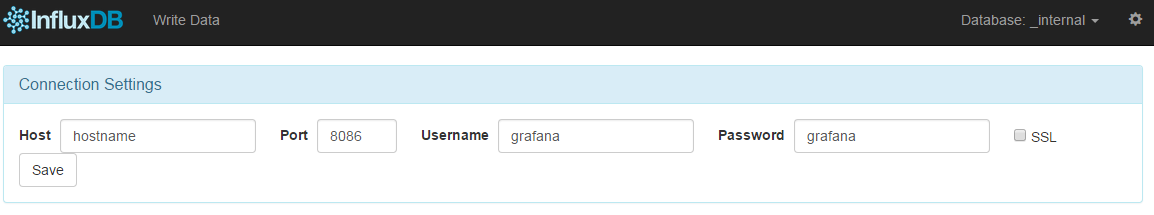
The localhost is the server where you installed the influxDB, and 8086 is the default port for querying data.
Please leave a comment if you have any questions or correct me if there is an update on the new change for these applications.