Querying and Templating on Grafana with InfluxDB
Using InfluxDB on Grafana is not quite common comparing to Graphite, another data source engine. Different data sources require different settings. The configuration process includes locating the measurements, finding the correct stats info, and filtering the result with refined condition.
Query
The snapshot blow shows a configured graph with query, template variables, and alias patterns.
Editor tag filters
To add a tag filter click the plus icon to the right of the WHERE condition. You can remove tag filters by clicking on the tag key and select --remove tag filter--.
Regex matching
You can type in regex patterns for metric names or tag filter values, be sure to wrap the regex pattern in forward slashes (/). Grafana will automatically adjust the filter tag condition to use the InfluxDB regex match condition operator (=~).
Editor group by
To group by a tag click the plus icon after the GROUP BY ($interval) text. Pick a tag from the dropdown that appears. You can remove the group by by clicking on the tag and then select --remove group by-- from the dropdown.
Alias patterns
$m= replaced with measurement name$measurement= replaced with measurement name$col= replaced with column name$tag_hostname= replaced with the value of the hostname tag- You can also use
[[tag_hostname]]pattern replacement syntax
Variable Templates
Below is the snapshot on the page to configure the variable template
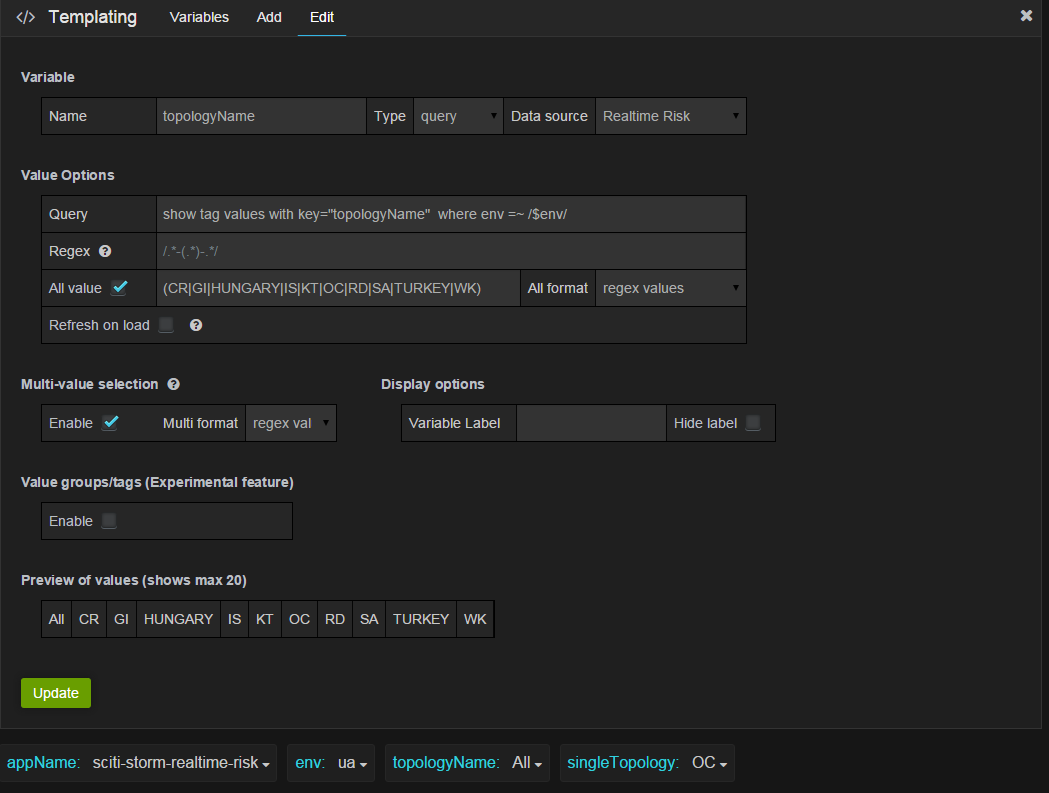
You can create a template variable in Grafana and have that variable filled with values from any InfluxDB metric exploration query. You can then use this variable in your InfluxDB metric queries. For example you can have a variable that contains all values for tag topologyName if you specify a query like this in the templating edit view.
1 | 1. SHOW TAG VALUES WITH KEY = "topologyName" |
You can also create nested variables. For example if you had another variable, for example env. Then you could have the hosts variable only show hosts from the current selected region with a query like this:
1 | 1. SHOW TAG VALUES WITH KEY = "hostname" WHERE env =~ /$env/ |
Additionally, the order of each variable template matters. You may refer to a former variable’s query results in a latter defined variable.
Little Tips
Basically, query and template variable are very easy to edit as long as you know what and where to find your data. Here is a few tipping points I summarized when I configured my Grafana.
- Try to use tag to generate the expressive name for measurement/table, this will make your life easier when you create template variable and form your own query
- When you want to select the multiple value in template variable, make sure you check All value tab and choose regex value for both multi format and all format
- In the retention policy from InfluxDB, you configure the frequency you perform a housekeeping procedure to clean up out-dated data.
- For timer measurements, you will find a lot sub-metrics such as mean, last, max, or min. They are calculated by StatsD from a whole data set received in one flushing period. Ensure select the correct one when you query your graph.