Collecting and analyzing metrics are the key to understand a system’s runtime behaviors and thus to provide a better guideline of optimization. As the user of a metrics system, you might want to collect metric and event with simple APIs, retrieve historical metric data, and view visualized metrics statistics.
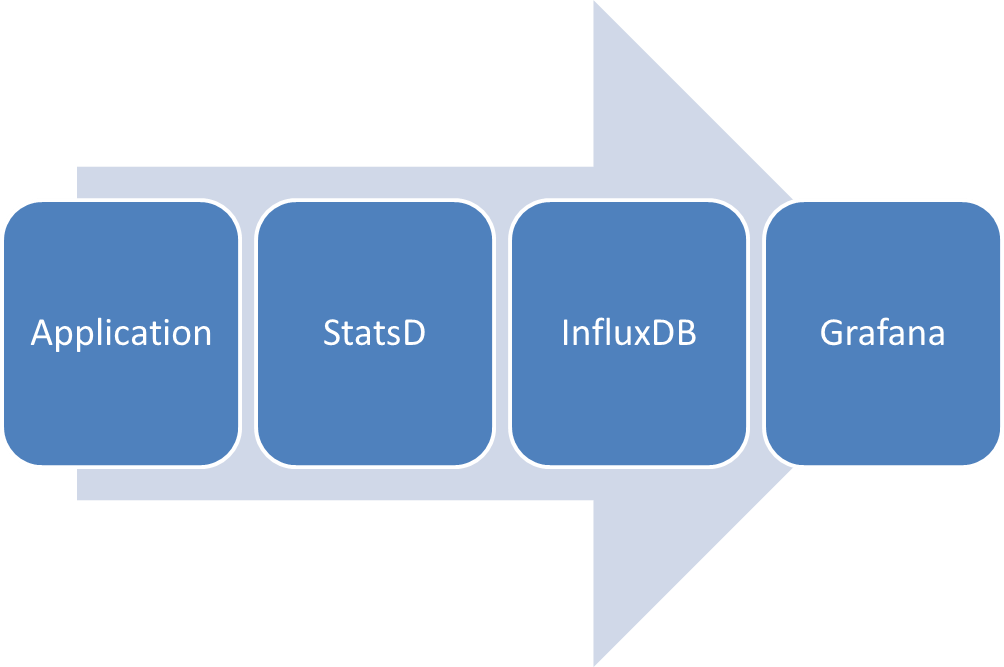
This article shows you how to build a metric system with StatsD, influxdb, and Grafana, as an example metrics system that composes of a client, a data storage, and visualization UI. There are many available open source packages.


